Chart & Table Design
Charting Data, Spotting Relationships
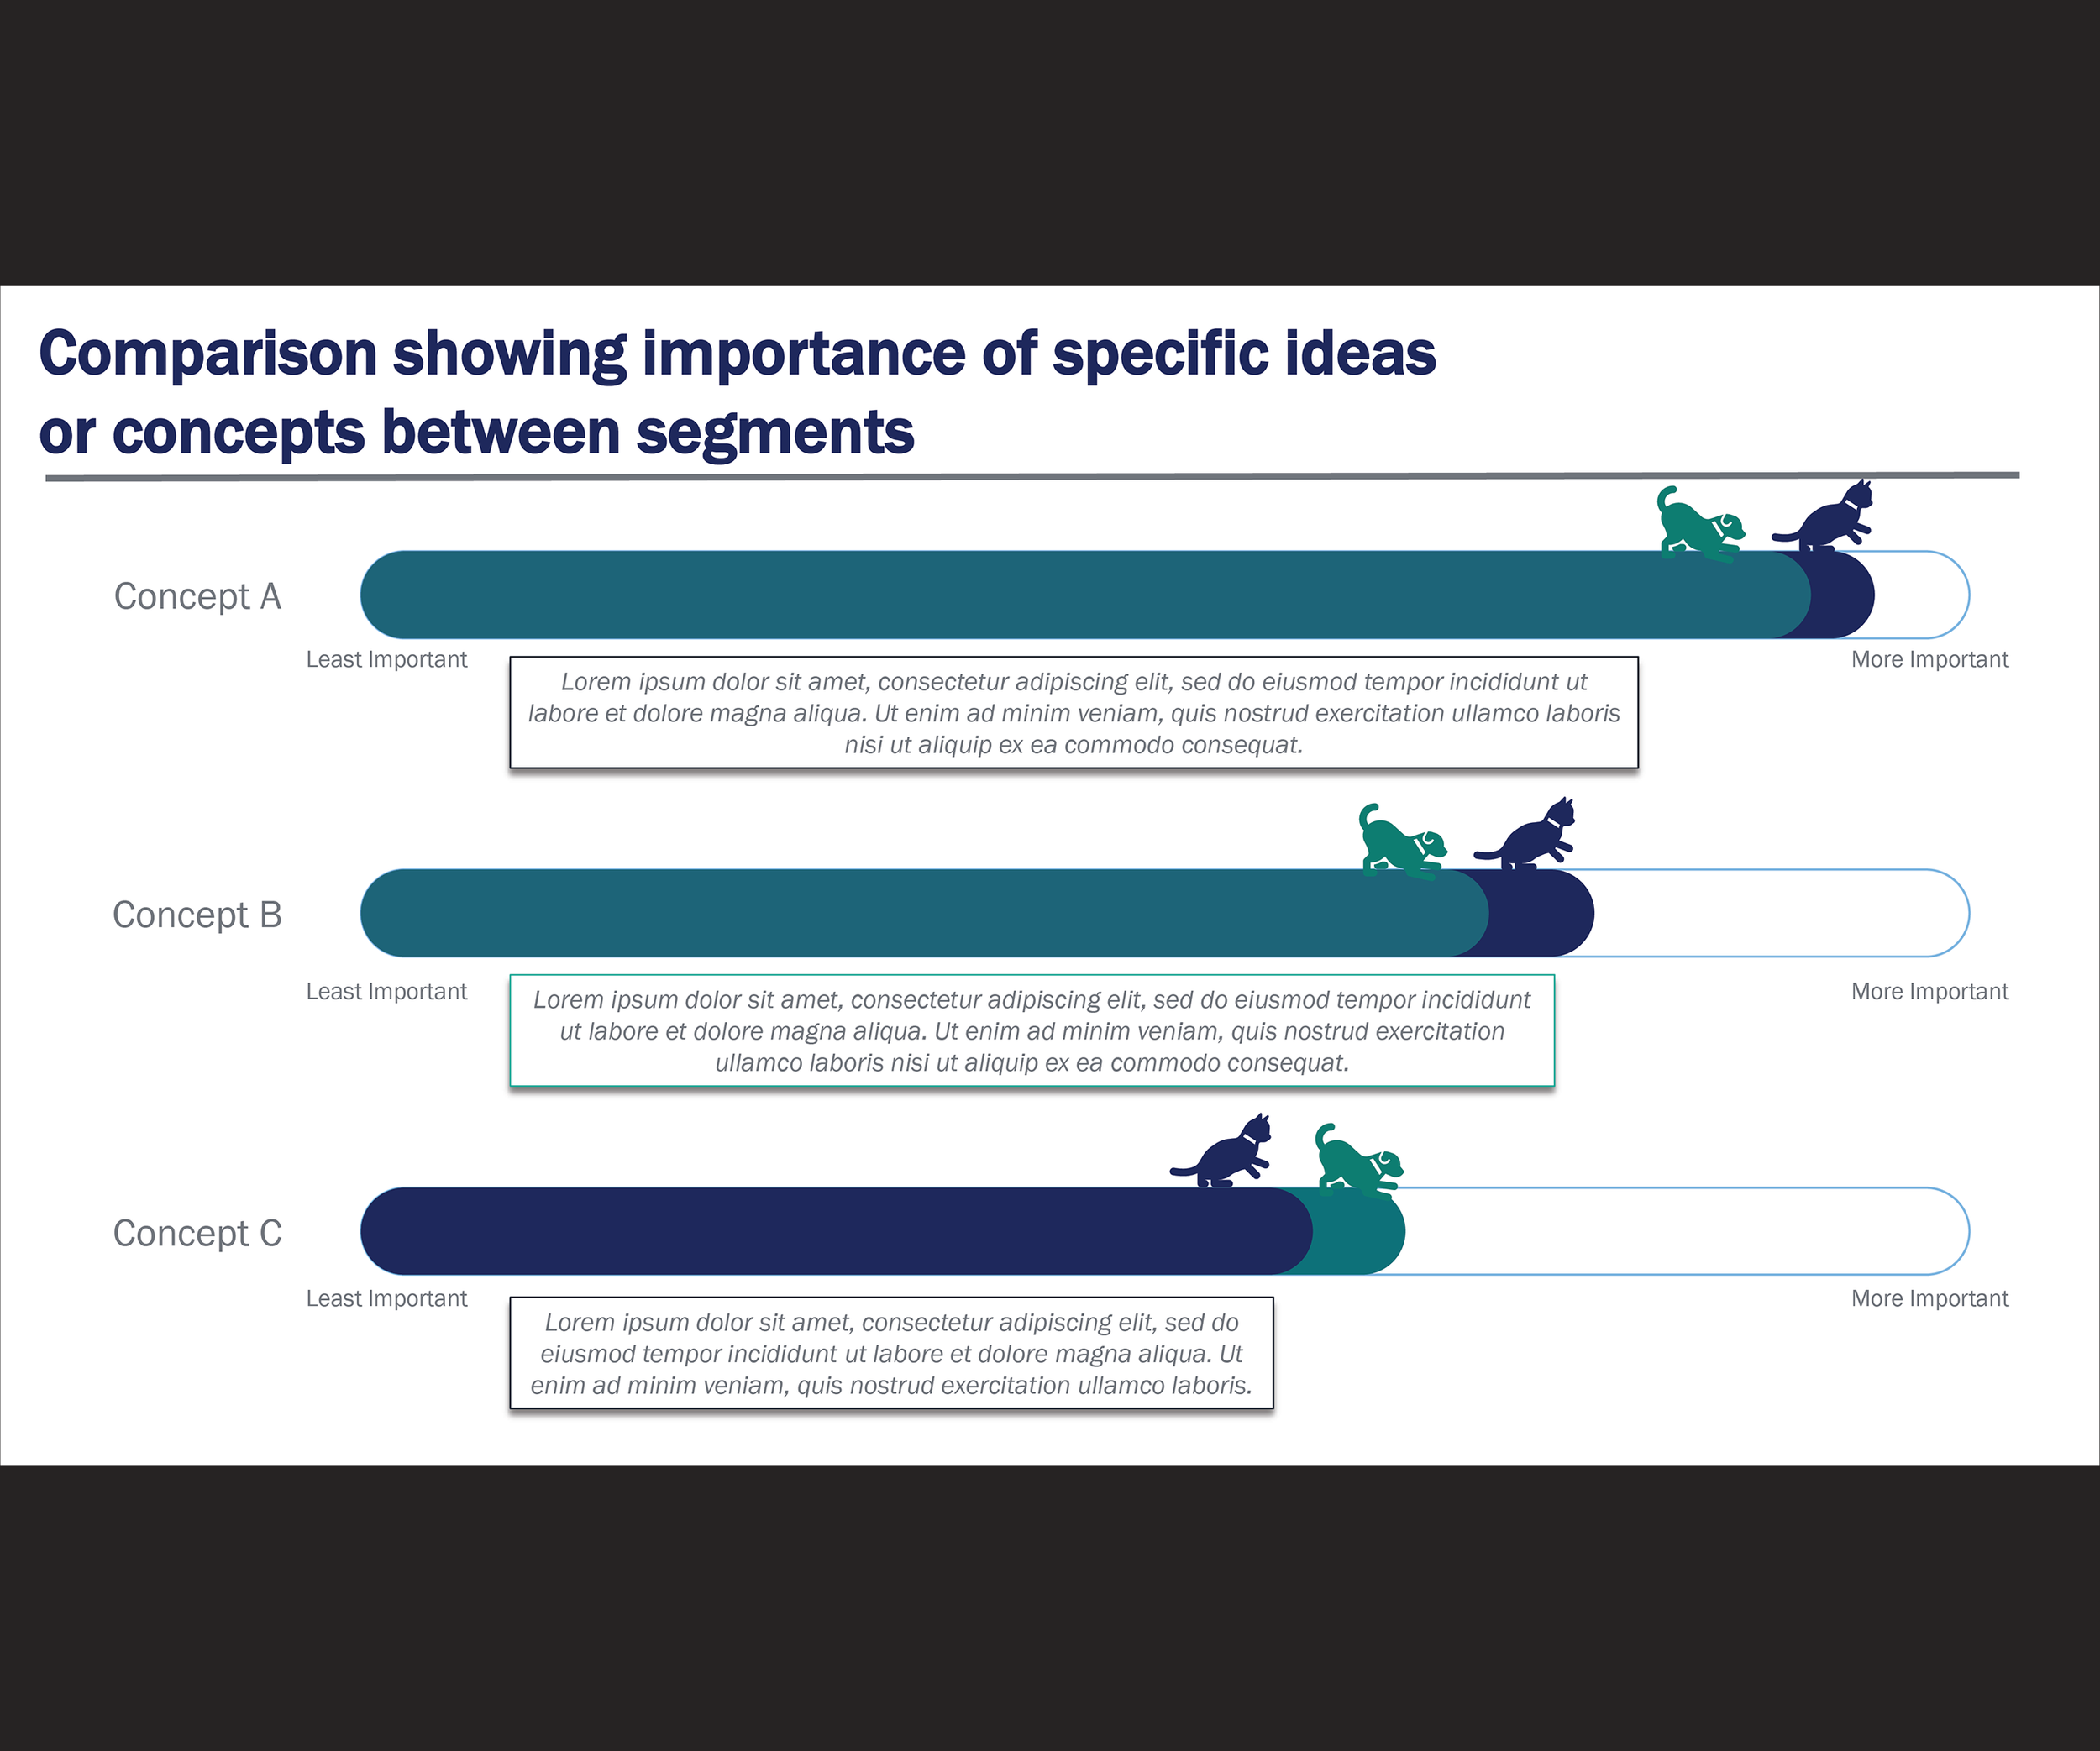
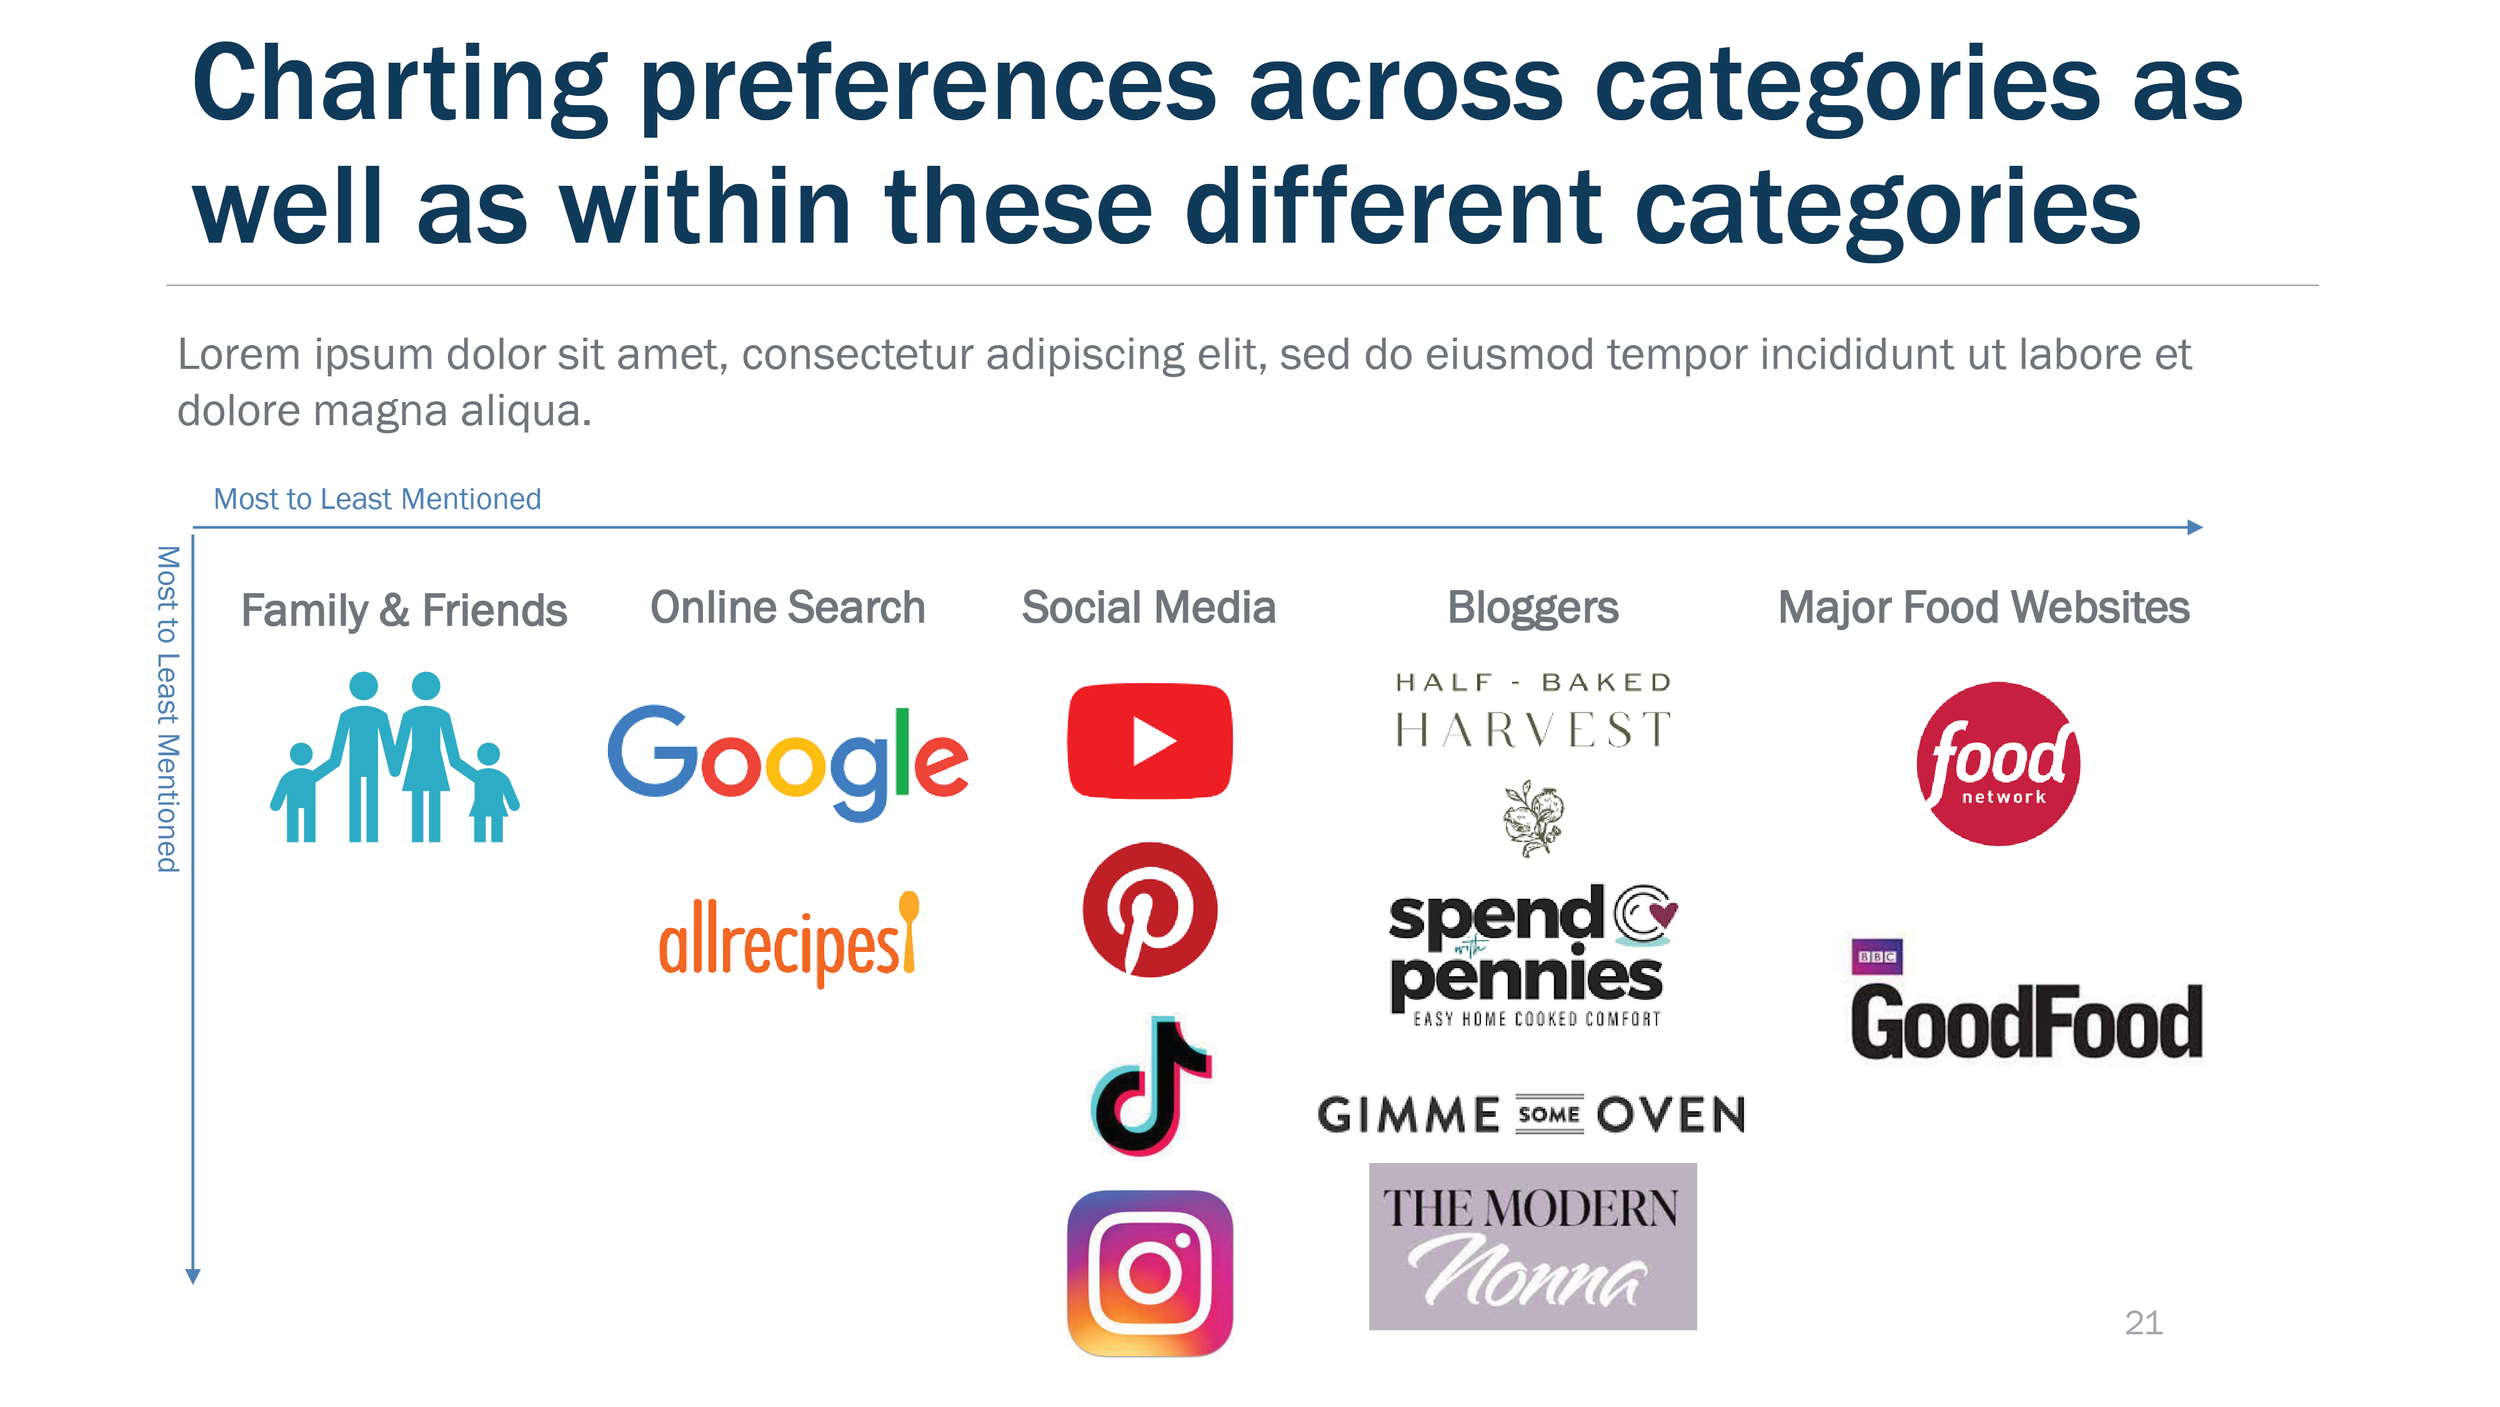
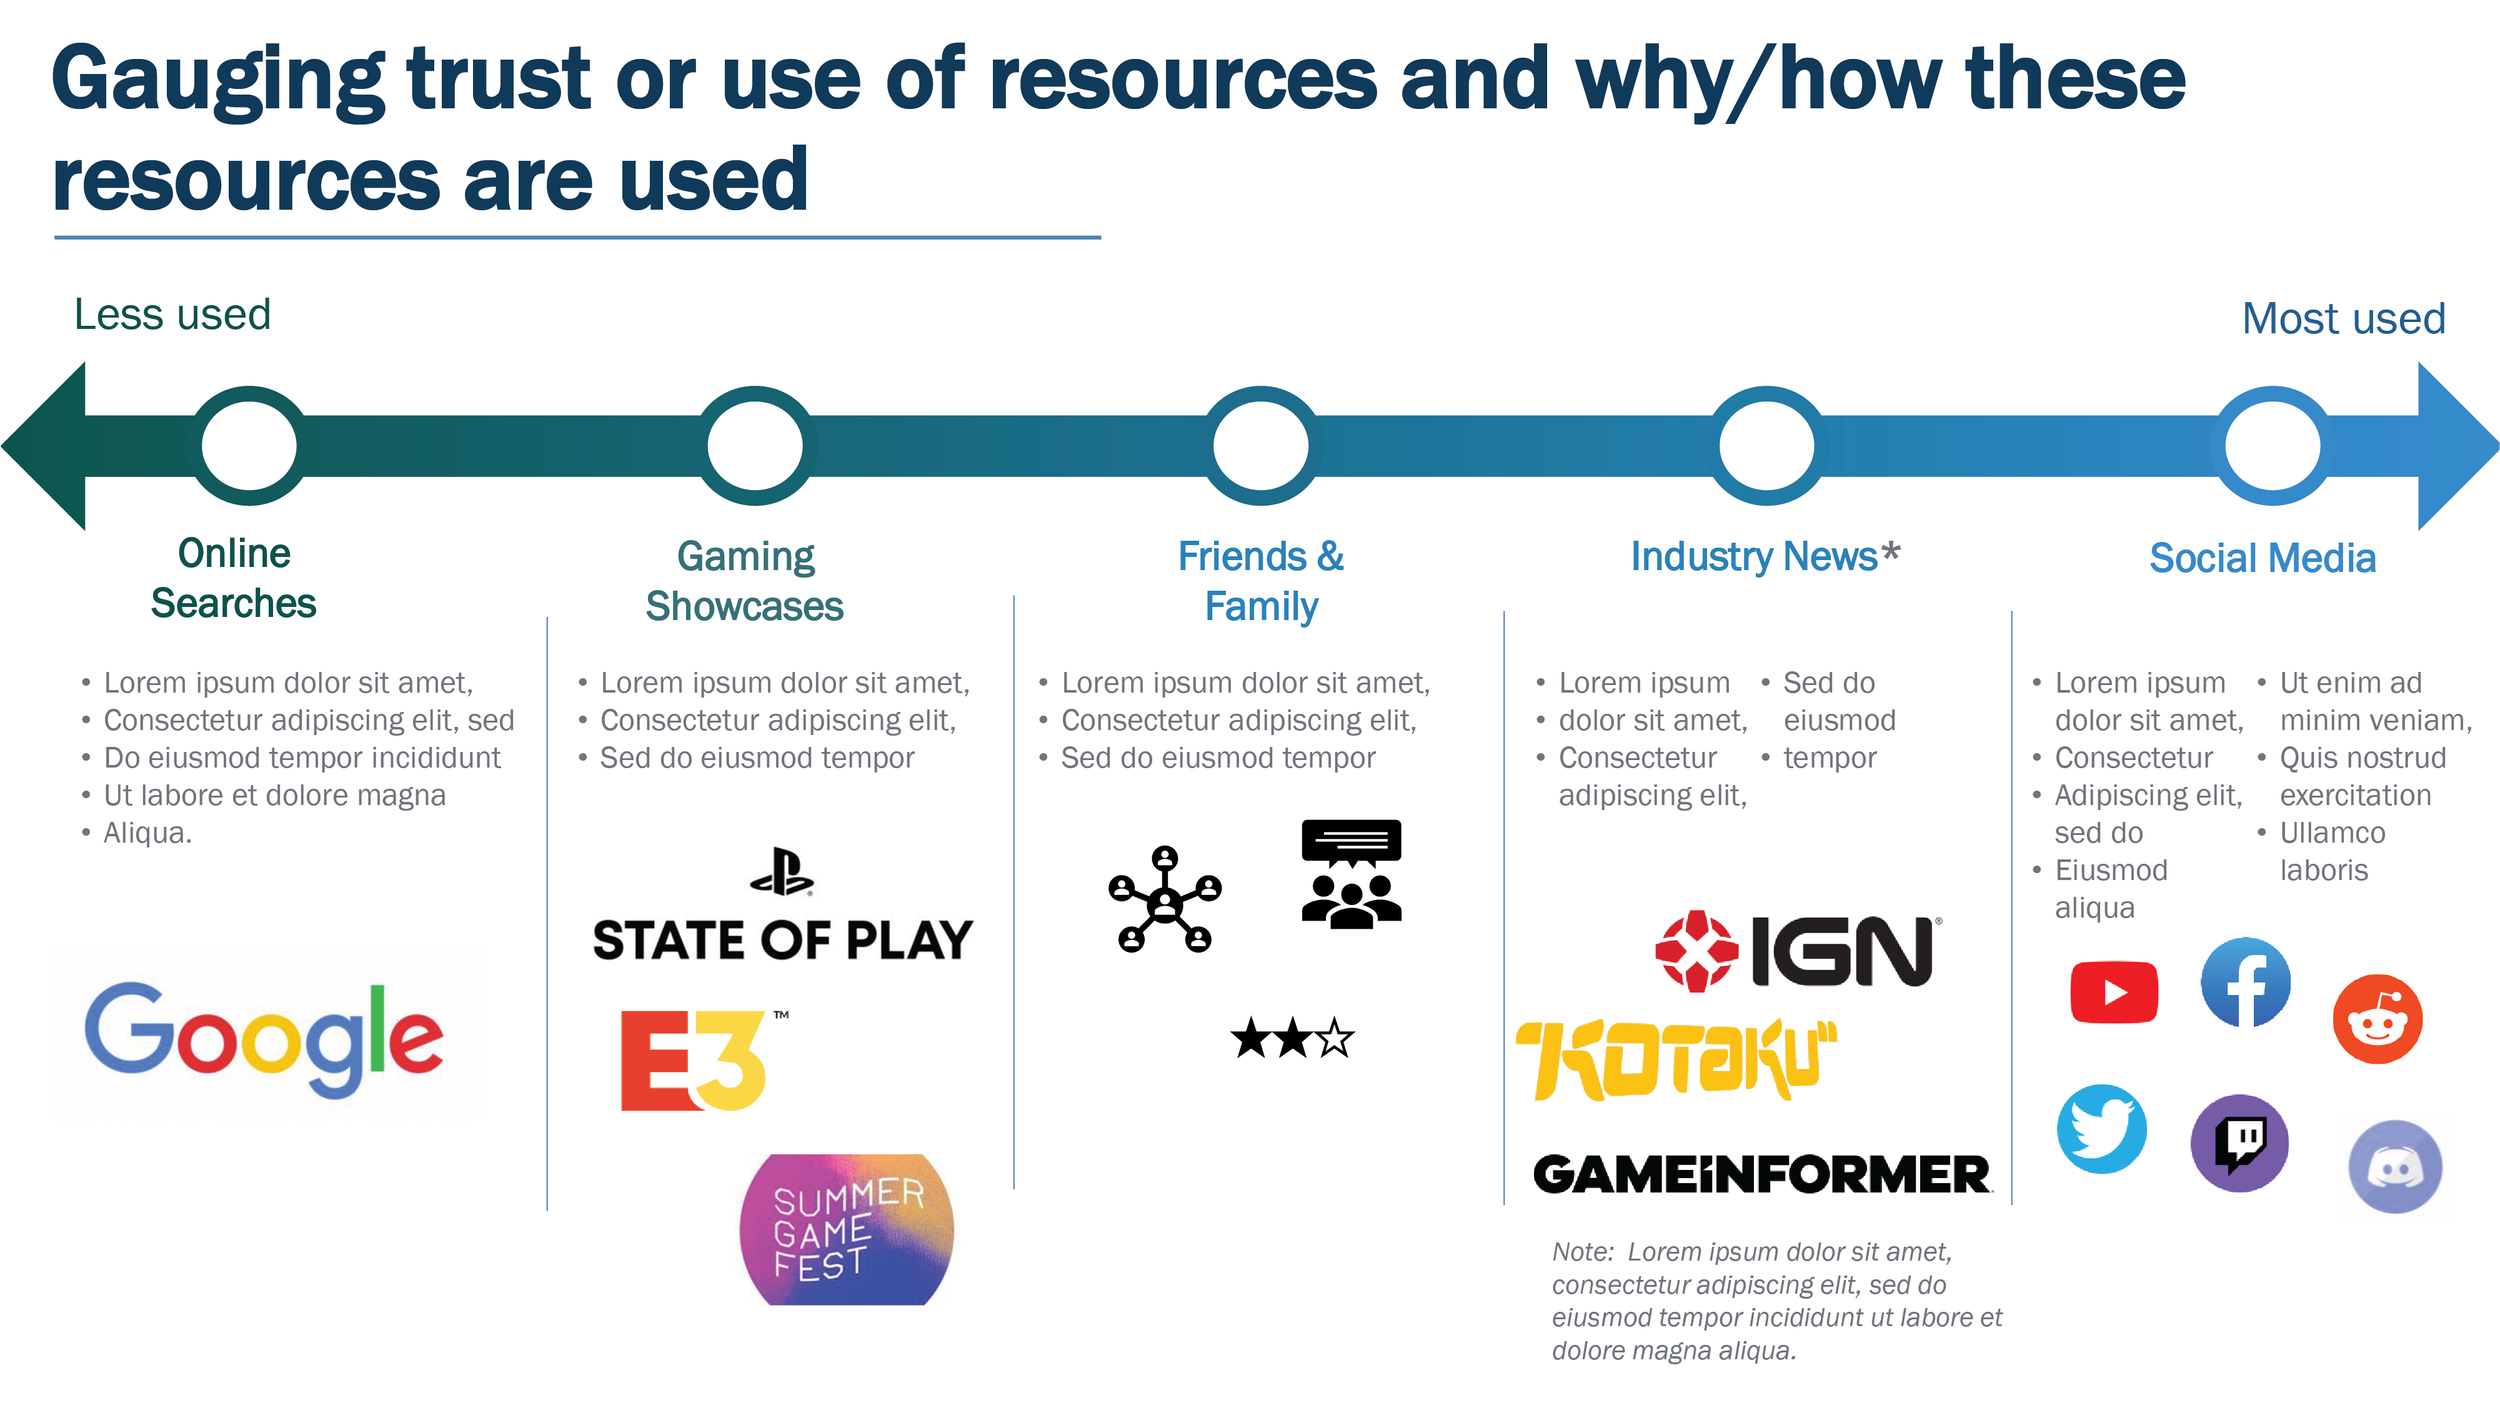
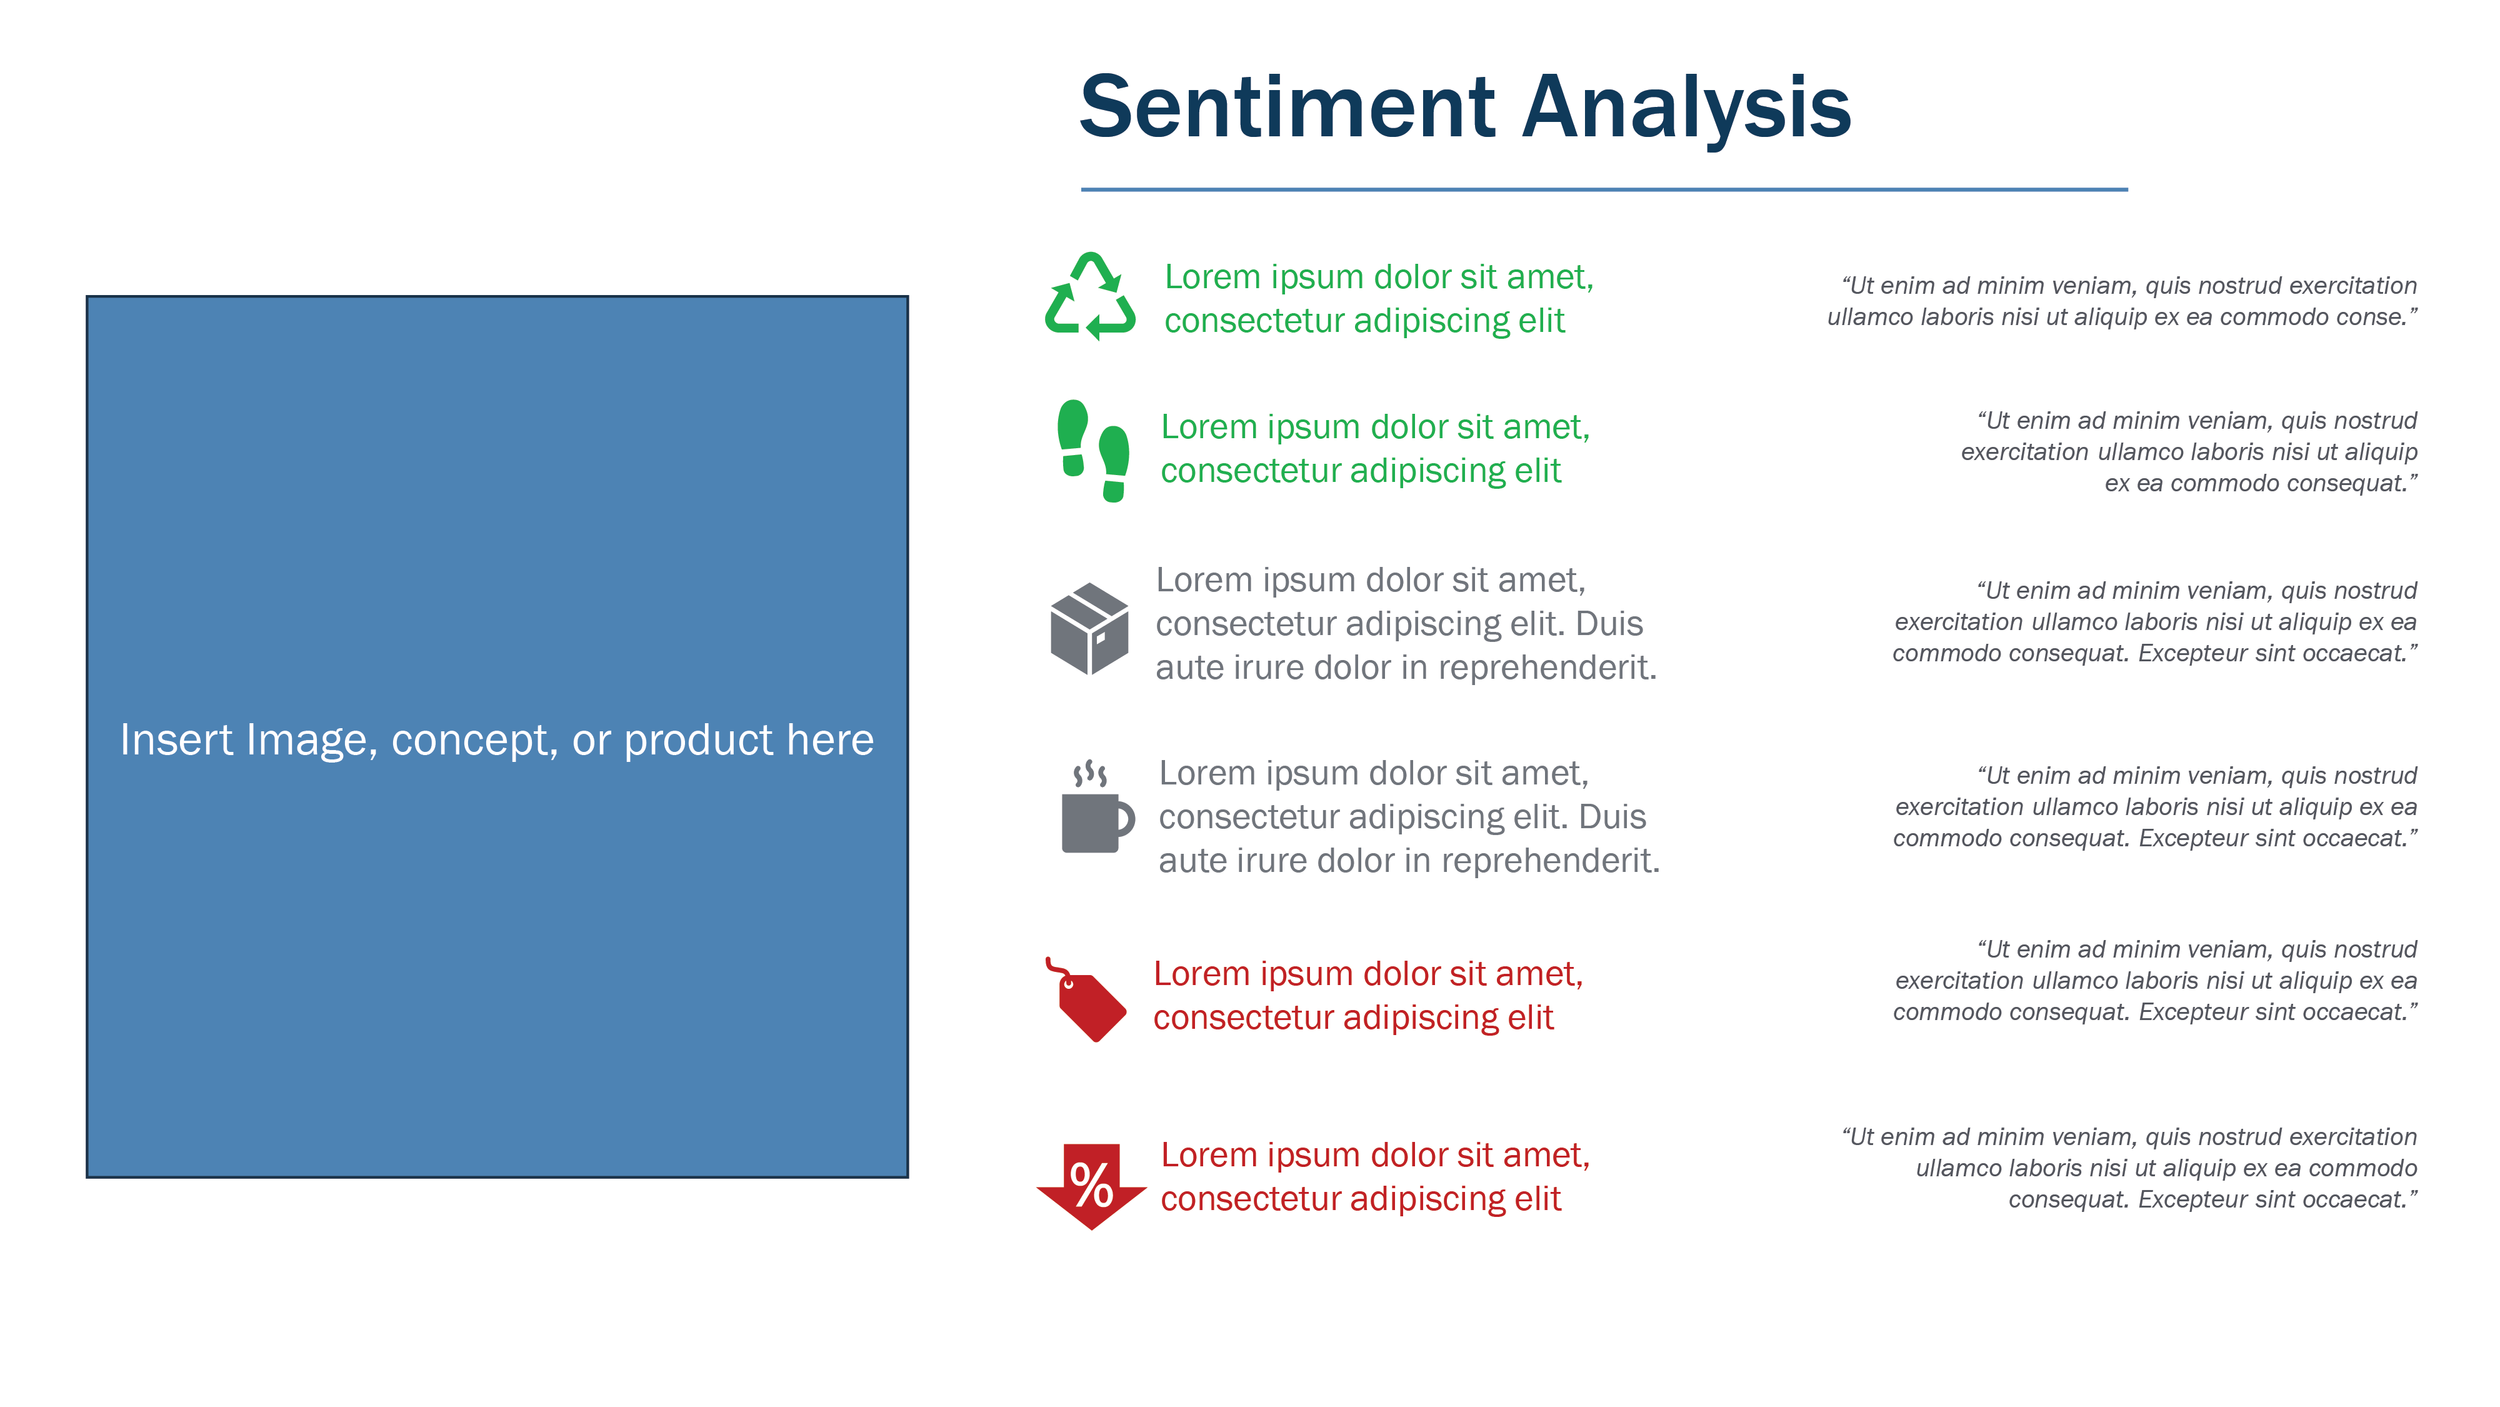
You utilize charts and tables to illustrate patterns, relationships, and key findings of your qualitative data in research reports and presentations.
By infusing our design expertise into the creation of charts and tables, we enhance the accessibility and communicative power of these visualizations, ensuring they are strengthened with memorable and engaging visual cues.
